Is Gold's Recent fall is taking it to Strong Buy Zone ??
Gold (XAUUSD) Price Is Approaching Support Level of $1,478, a Potential Reversal Zone

Gold Weekly Price Analysis – March 14
In case the Bulls maintain or increase their momentum the support level of $1,478 may be penetrated and the price will be aiming the low of $1,435. Should the support level of $1,478 holds, the price may reverse and face the north.
XAUUSD Market
Key levels:
Resistance levels: $1,550, $1,591, $1,643
Support levels: $1,478, $1,435, $1,389
Has to be related to MCX Gold Prices
XAUUSD Long-term Trend: Bearish
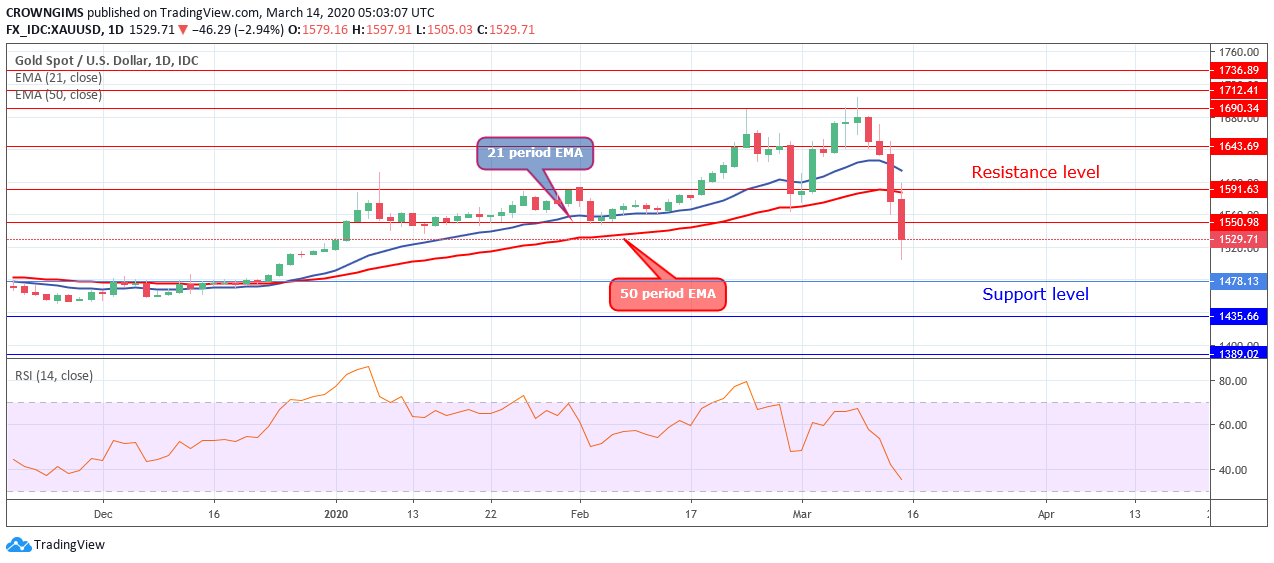
Gold is bearish on the long-term outlook. The Bulls dominated the Gold market for more than three weeks. The bullish momentum pushed up the price to the high of $1,690 on 09 March. The bullish momentum was exhausted and the barrier at the resistance level of $1,690 held the price. An evening star candle pattern emerged and the price obeyed the command of this bearish candle pattern. Gold price declined by penetrating downside the former demand levels of $1,643, $1,591 and $1,550. The metal is currently targeting the support level of $1,478.

The price is trading below 21 periods EMA and 50 periods EMA at a distance; this indicates that the Bears dominate the Gold market last week. In case the Bulls maintain or increase their momentum the support level of $1,478 may be penetrated and the price will be aiming the low of $1,435. Should the support level of $1,478 holds, the price may reverse and face the north. The Relative Strength Index period 14 is below 40 levels with the signal line pointing down to indicate a sell signal.
XAUUSD Medium-term Trend: Bearish
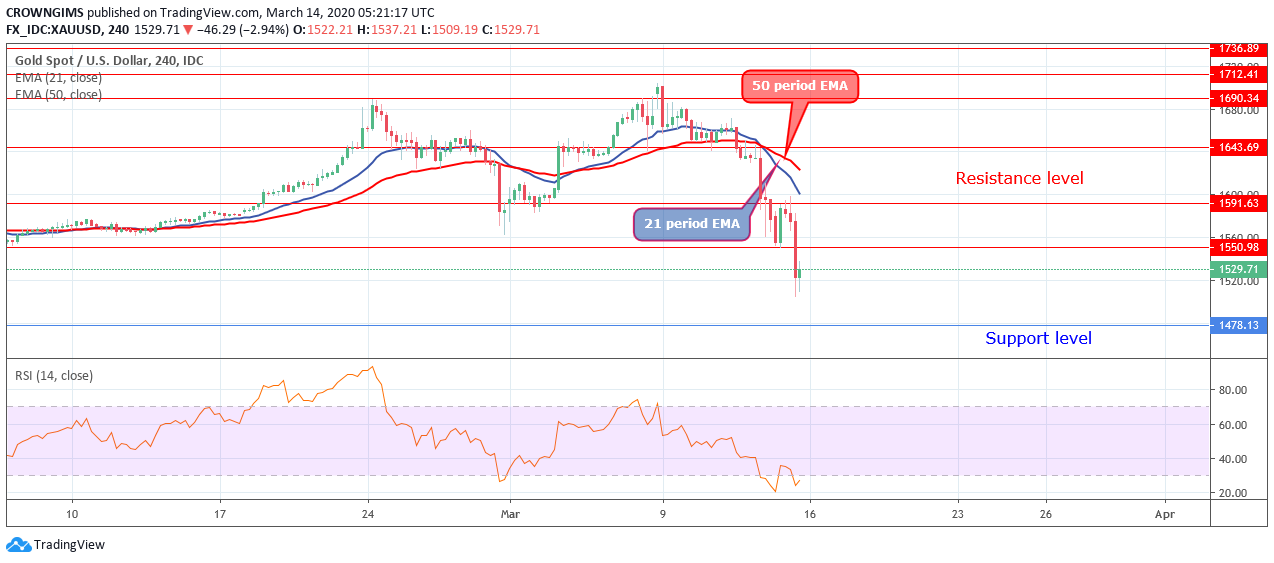
Gold is bearish on the 4-hour chart. On 09 March, a bearish engulfing candle pattern formed at the resistance level of $1,690. More bearish candles emerged after which the price decreased. Three major barriers were broken downside such as $1,643, $1,591 and $1,550. The price is moving towards the support level of $1,478.

Gold is trading below the 21 periods EMA and 50 periods EMA which implies a strong bearish movement in the Gold market. The Relative Strength Index period 14 is at 20 levels with the signal lines pointing up to indicate a buy signal which may be a pullback

Comments
Post a Comment