Gold-Silver Ratio Disparity, Is It Controlled InOrganically ??
Many things are driving gold higher in 2020. Silver is supposed to be correlated to gold, so it should be rising by close to the same amount. Yet, there has been a disparity in the metals market, and the famous “gold-silver ratio” is now at the widest level in years. On the heels of the surprise U.S. Federal Reserve interest rates cuts, more central banks around the globe are expected to add further economic stimulus to counteract some of the negative effects of the coronavirus outbreak.
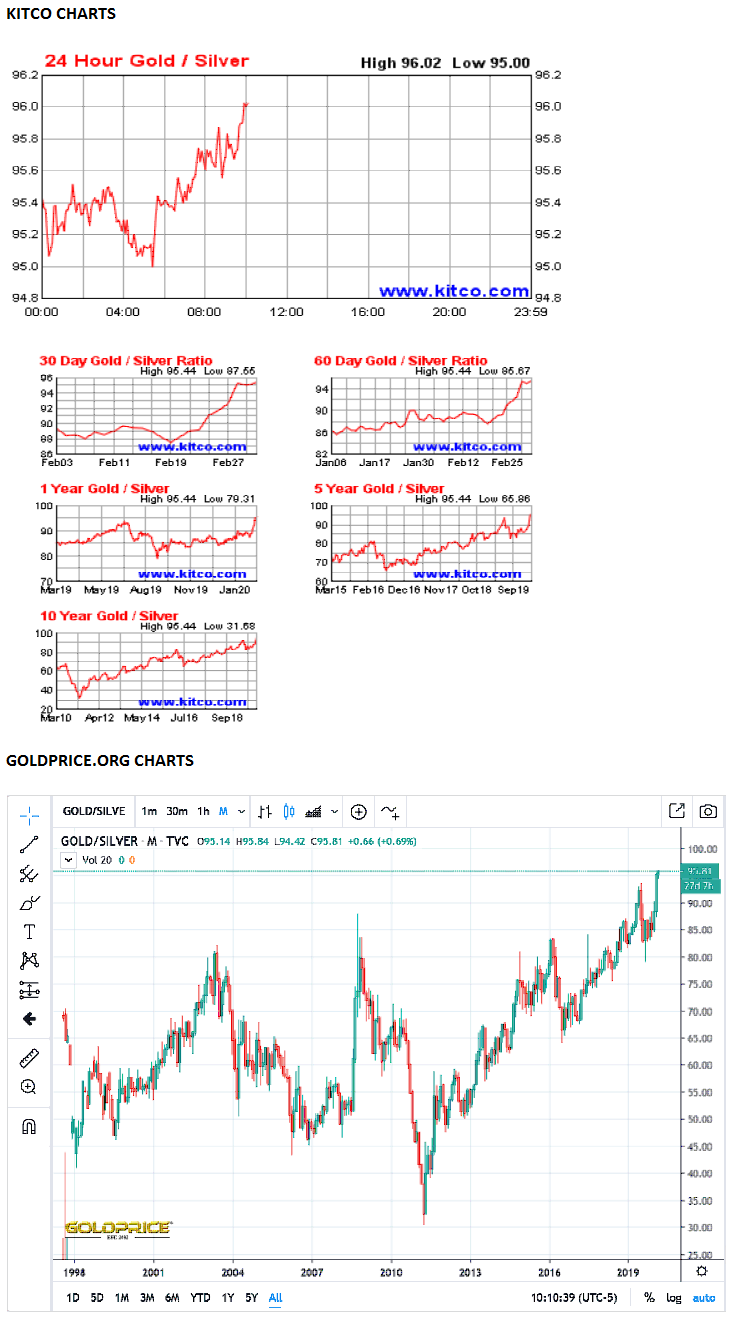
At current prices of $1,640 per ounce of gold and $17.07 per ounce of silver, the current gold-silver ratio is roughly 96. In short, it takes 96 ounces of silver to equal the same value as gold. The disparity of gold and silver began to widen out in the last week of February.
As for silver, the problem here is that silver just is not the same reserve metal. Central banks aren’t buying silver like they have been buying gold. Silver is often considered to be “the poor man’s version of gold,” but in many instances owning silver might be more practical than owning gold if the ownership is used for “barter” in some of the doomsday scenarios. There is also a role in the weak dollar in the mix, although most U.S. investors have a hard enough time getting the underlying asset call right without the volatility of the currency markets.
Looking through the charts at Kitco and Gold Price websites shows that the gold-silver ratio hit more than 20-year highs after it went above 94. As for the performance of the metals themselves, using the SPDR Gold Shares (NYSE: GLD) and the iShares Silver Trust (NYSE: SLV), gold was up 7.7% so far in 2020 versus a roughly 4% drop in the price of silver. And over the past year, gold was up about 26.5%, compared with a rise of just 13.2% for the lesser metal.
According to the World Gold Council’s 2020 outlook for gold, the interplay between market risk and economic growth was expected to be the key driver for gold demand this year. The focus was on financial uncertainty, lower interest rates, slower global economic growth and gold price volatility. That was on the heels of gold rising over 18% in 2019, the best year since 2010 in dollar terms. The council’s views also noted:
- Financial and geopolitical uncertainty combined with low interest rates likely will bolster gold investment demand.
- Net gold purchases by central banks likely will remain robust, even if they are lower than the record highs seen in recent quarters.
- Momentum and speculative positioning may keep gold price volatility elevated.
- While gold price volatility and expectations of weaker economic growth may result in softer consumer demand near term, structural economic reforms in India and China will support demand in the long term.
The World Gold Council further said:
Gold has historically performed well in the 12 to 24 month period following policy shifts from tightening to “on-hold” or “easing” – the environment in which we currently find ourselves. And, historically, when real rates have been negative, gold’s average monthly returns have been twice as high as the long-term average. Even slightly positive real interest rates may not push gold prices down. Effectively, our analysis shows that it has only been in periods with significantly higher real interest rates – an unlikely outcome given the current market conditions – that gold returns have been negative.
We have included two charts below, the first from Kitco and the second from Gold Price for longer dated reviews of the gold-silver ratio.
Author- Vivek Shukla
Chief Portfolio Manager
Wealth Guru Financials
#9198544444
Twitter- @vivekshukla4444


Comments
Post a Comment